Setup Guide
Dataskop Setup Guide
With this step-by-step guide you will be able to
- Set up a Dataskop Gateway and use the Dataskop Config App
- Create a configuration for your visualizations
- Use DataskopAR to display visualizations with data from virtual sensors
At the bottom of the page you will find a collection of all links used in this guide.
Dataskop Backend
In this section you will download a Dataskop Gateway and the Dataskop Konfig App to create a simulated sensor to be available in a project.
Creating a Dataskop Gateway
Download the Dataskop Gateway for Windows and save it in a location on your computer. Extract the contents of the downloaded file to a new folder and start the "DataskopGateway.exe".
In the opened console window enter a name for the gateway or use the default provided name by pressing Enter. After choosing a name enter a description for the gateway.
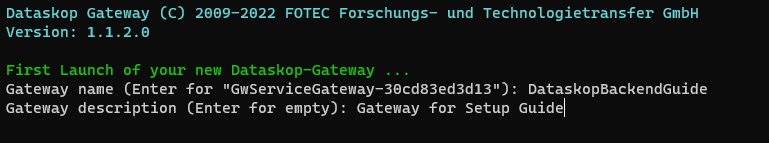
Enter a name and a description for your gateway to recognize it easily later.
After the creation of the gateway it will automatically start and make virtual IoT Devices available which will provide values, like CPU temperature from the computer it is running on. By pressing the 'S' or the 'P' key you can start or stop the virtual devices. Pressing 'ESC' stops the gateway completely.
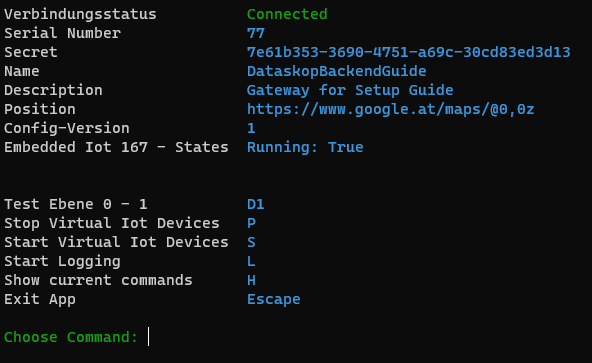
'Running: True' means the virtual IoT devices are active.
Finally, copy or write down the last segment of the "Secret" key displayed in the console, as this is needed to add the gateway to the Config App.
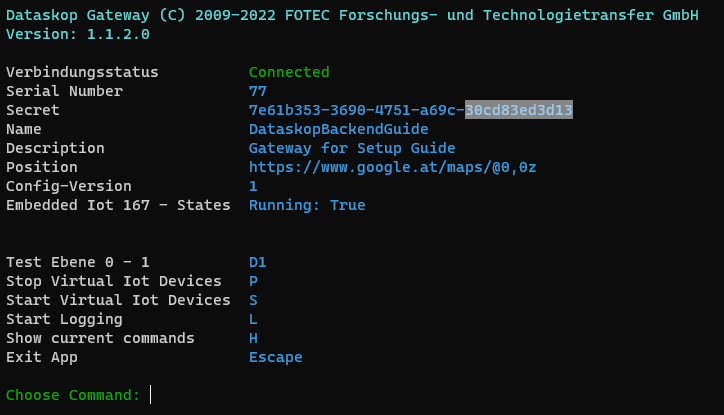
Last segment of the secret key.
Dataskop Config App
Download the Dataskop Config App and extract the contents in a new folder. Open the folder and run the "Dataskop.exe".
Caution: Before you can continue here you need to be added to a Company by an admin from your organization and you need to be assigned the role of an admin too.
After the application started, go to the "Infrastruktur" (Infrastructure) tab. In this view you select your company from the dropdown menu and click on the '+' button on the "Gateway" column.
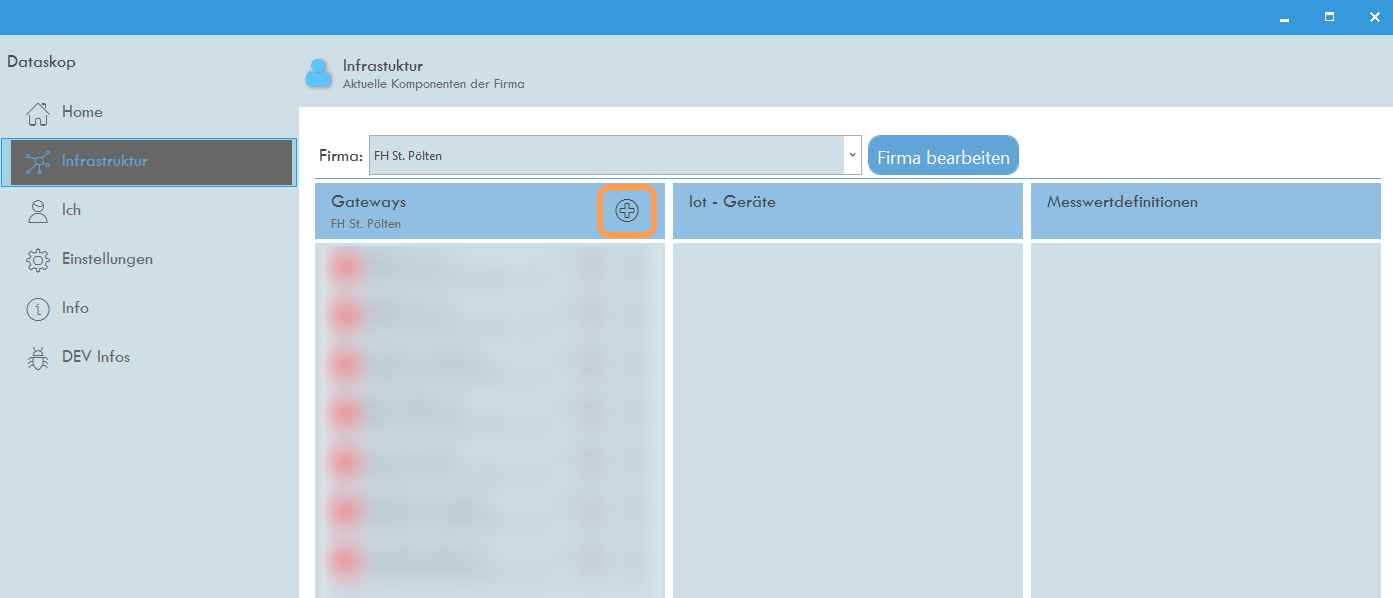
'Infrastructure' View
Here you select your previously generated gateway and enter the last segment of the secret key in the input field. If the information is correct press on the "Sichern" (Save) symbol and your gateway will be added to the company.
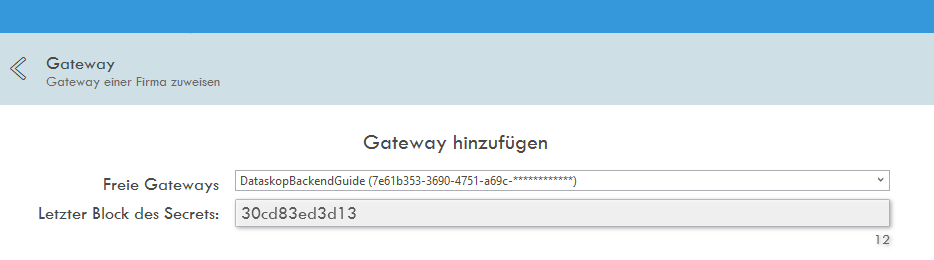
Adding a gateway by selecting it and providing the secret segment.
Back in the infrastructure view you should now see your running gateway indicated by a green rectangle in front of its name. Clicking on it displays the simulated IoT device named "States" in the middle column which will reveal the virtual sensors once clicked on it in the far right column "Messwertdefinitionen" (Measurementdefinitions)
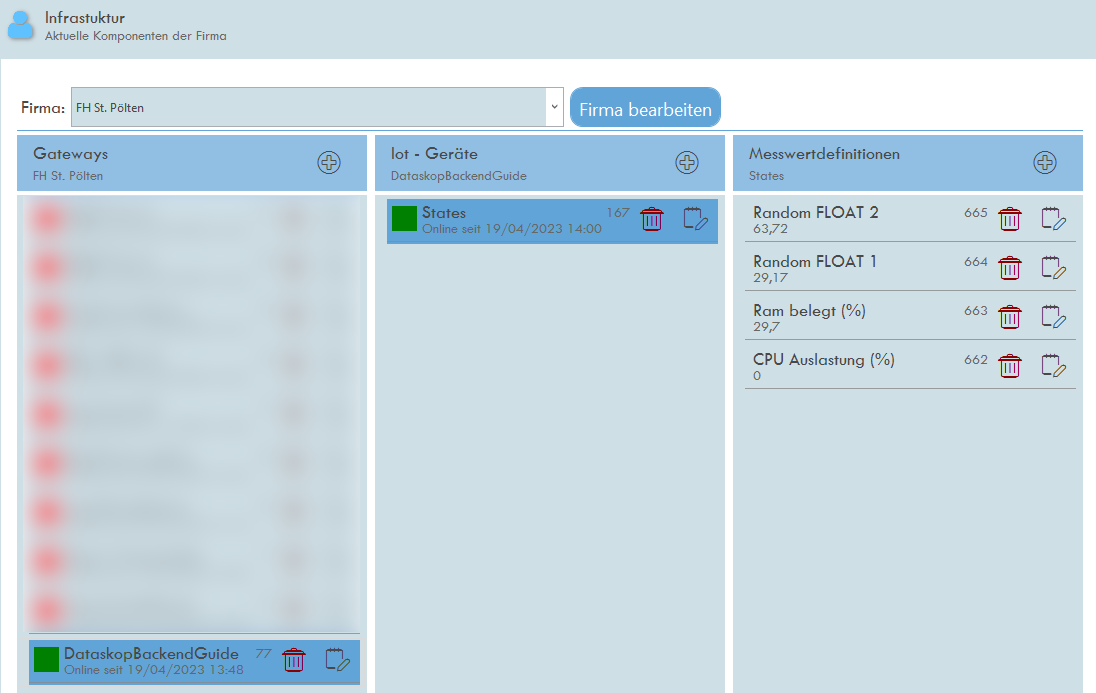
The created gateway will be displayed in the left column
The simulated device comes preconfigured with 4 virtual sensors (2x randomly generated float values, 1x percentage of used RAM and 1x percentage of cpu-usage) but additional virtual sensors can be added as well.
Now that we have added the gateway to the company we can create a project that uses the measurement definitions available through it.
In order to create a project you need to select the 'Home' tab, your company in the dropdown menu and press the "Firma bearbeiten" (Edit Company) button to access the settings of a company.
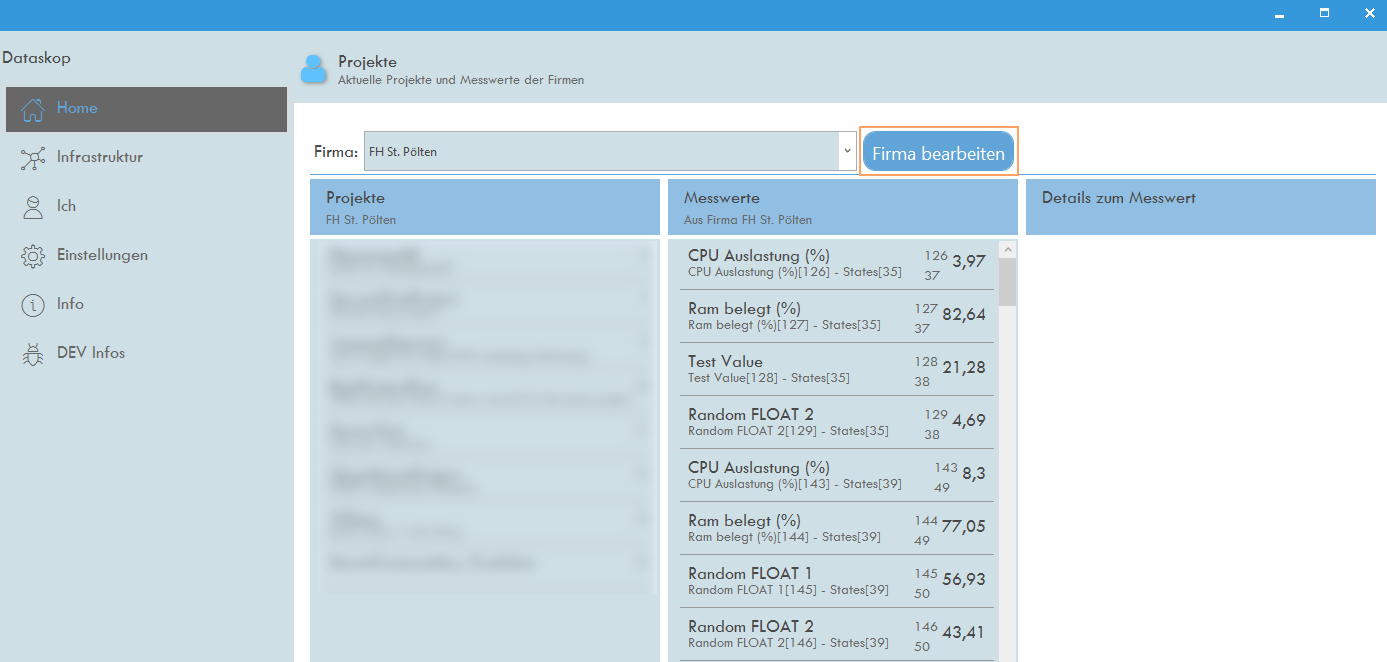
Initial 'Home' View
In the next screen click the '+' button in the "Projekte" (Projects) column to add a new project.
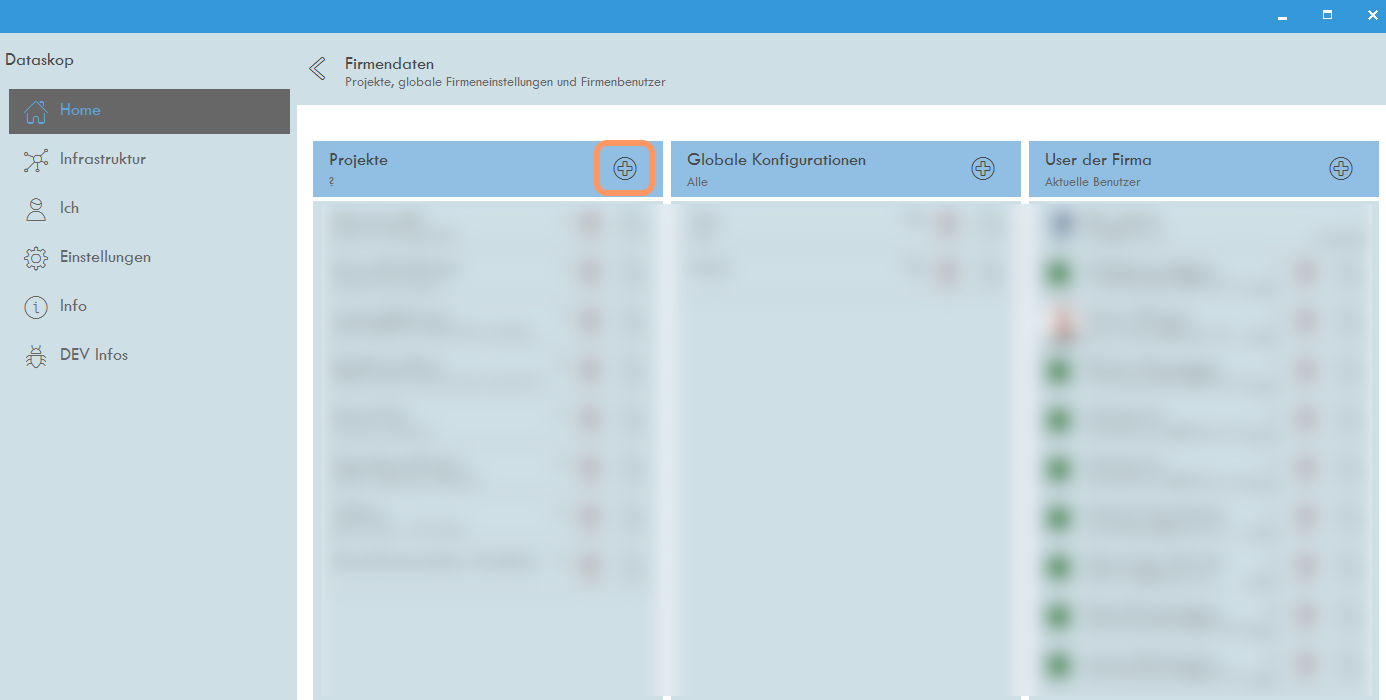
Company Settings Overview
On the left enter your projects name and a description. Leave "Zusätzliche Einstellungen" (Additional Properties) empty for now.
In the middle column select the added gateway in the upper dropdown menu, which then displays all the available measurement definitions from this gateway.
Click on the '+' sign next to a measurement definition to add this particular sensor data to the project and they will move to the right column.
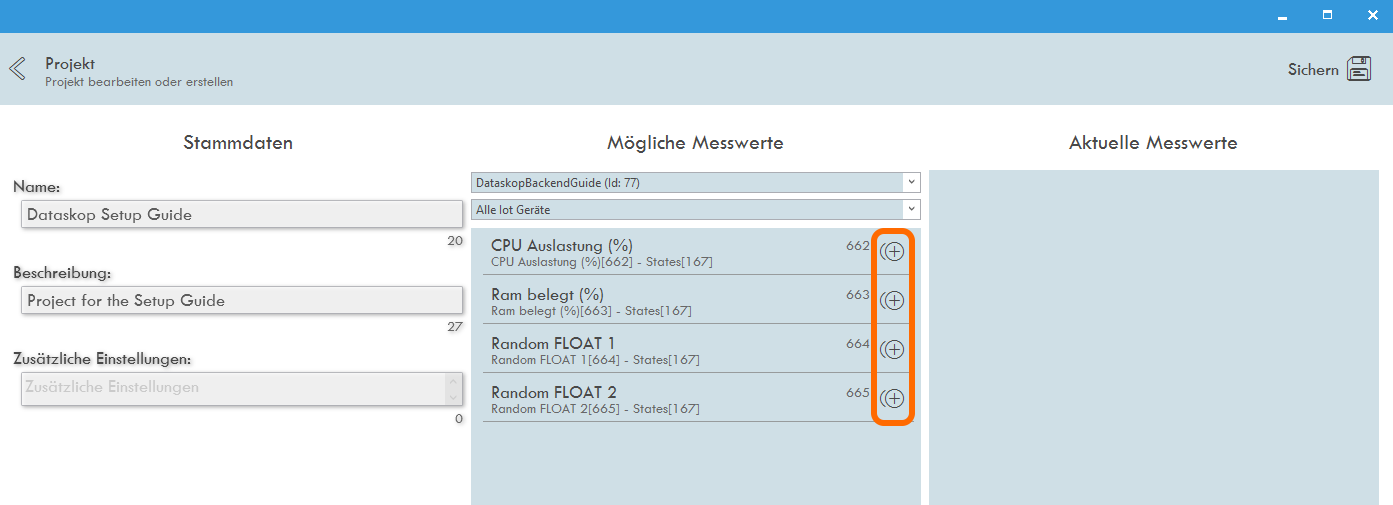
Creating a Project
After you finish adding the wanted measurement definitions, click on the 'Sichern' (Save) button and go back to the 'Home' view. If you select your created project it displays the added definitions in the middle column and by clicking on it reveals all information about it in the right most column.
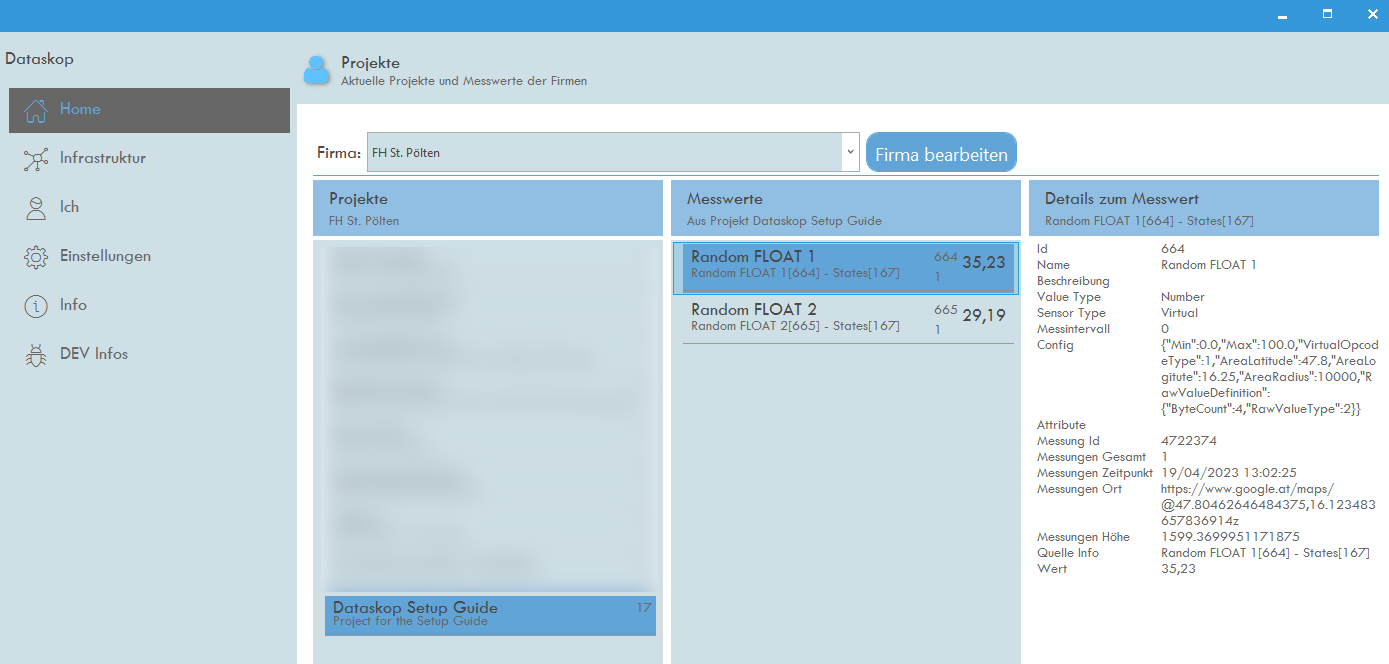
Project Overview
Adding and editing virtual sensors
By clicking on the '+' button in the Measurement Definition column in the Infrastructure view you can add an additional virtual sensor to your gateway device.
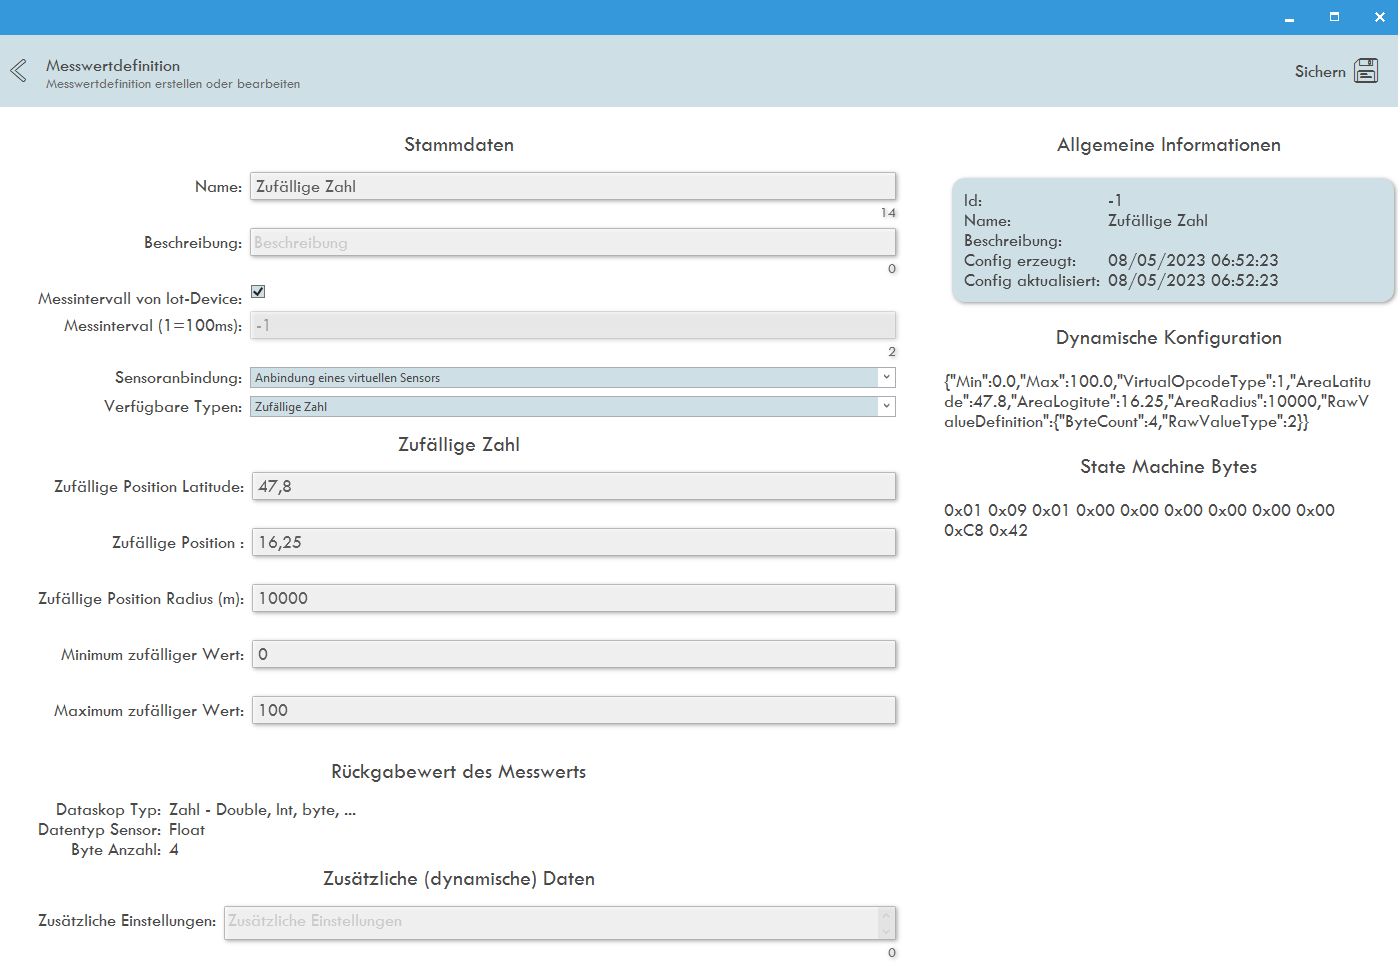
Add/Edit Measurement Definition View
| Name | The name of the sensor |
| Description | The description for the sensor |
| Measurement Interval | If checked the interval of producing values will be defined by the gateway otherwise the sepcified interval will be used |
| Sensor Provider | Where the sensor will run on (keep this on virtual sensor) |
| Value Type | The value type of the delivered measurement |
| Position | First text field Latitude, second text field Longitude. If you want your virtual sensor to always be on the same position keep the random position text field at 0 |
| Min Value | The minimum value the sensor type will report |
| Max Value | The maximum value the sensor type will report |
| Additional Properties | Text field for additional properties, which is used for the visualizations |
After you are finished configuring your virtual sensor, click on the 'Save' button and you will return to the "Infrastructure" view. Do not forget to also add the newly created measurement defintions to your project by editing an existing one.
Once it is created the gateway will start to automatically produce values in the given interval within the specified minimum and maximum values.
To delete a measurement definition simply click on the trash bin button next to a measurement definition.
Adding OpenSenseMap data
TBD
Adding 'The Things Network' data
TBD
Configure your sensors for visualizations
Backend Vis Configurator
In order to visualize your newly added sensor data in the AR application some adjustments in the projects information and each measurement definition have to be made. Because that information is provided in a JSON-format a website was made available to make it easier to create that information.
Open the Backend Vis Configurator here.
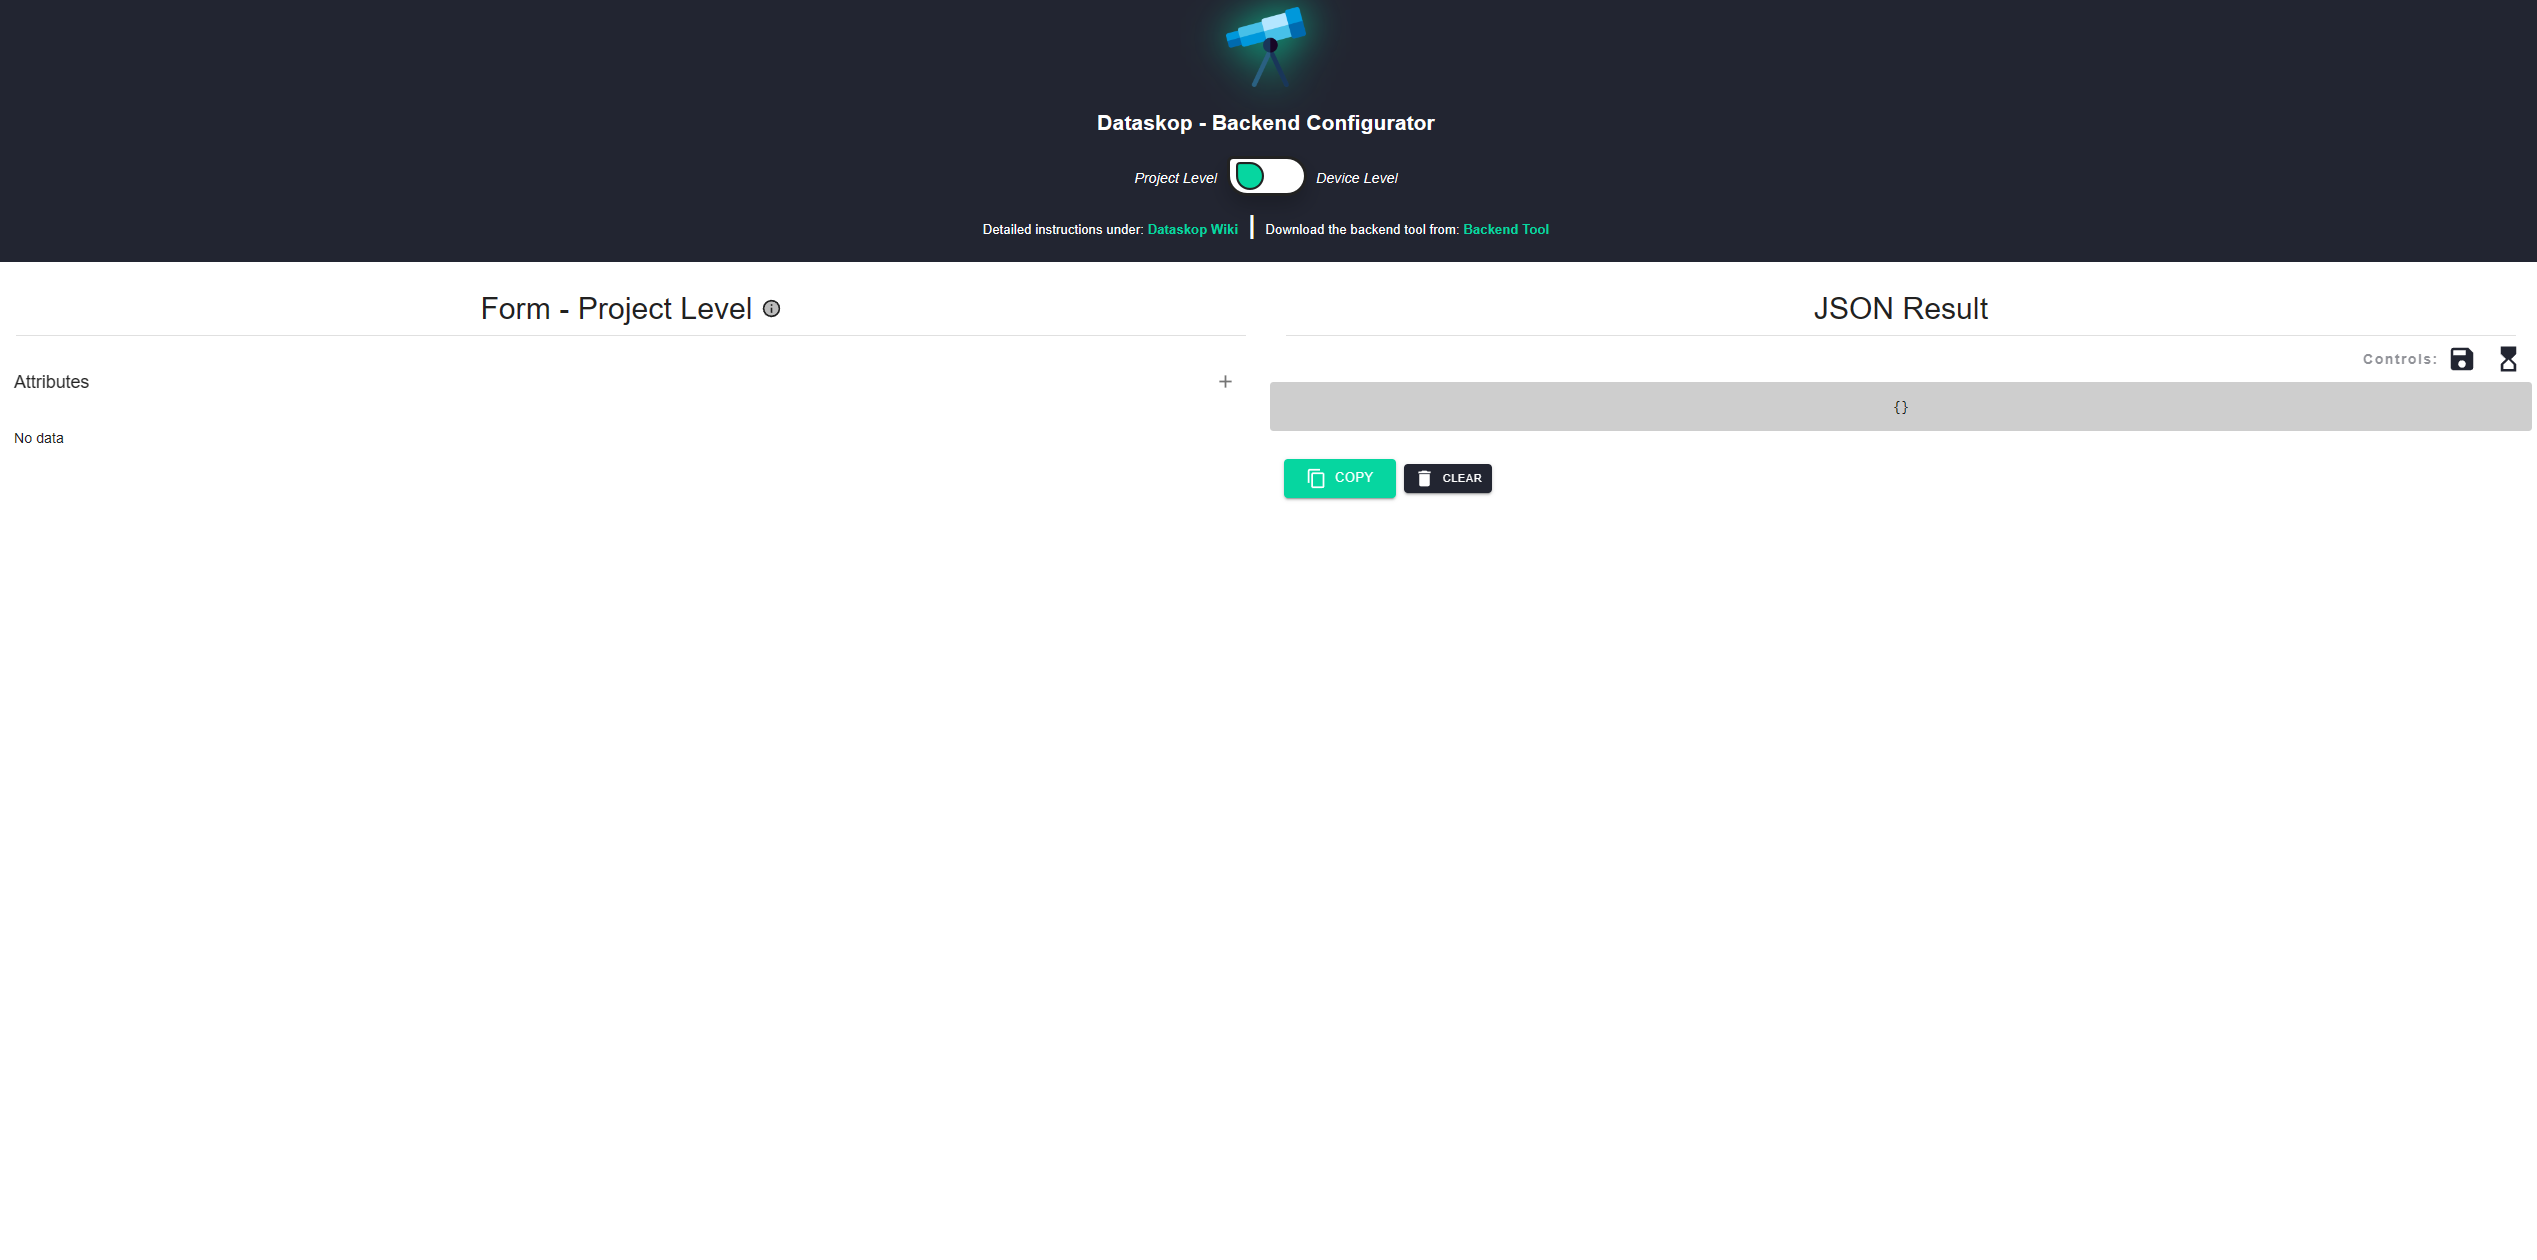
Backend Vis Configurator View
At the top you can switch between project and device level. Start off with the project level and click on the '+' button in the left pane to add a new 'Attribute' to the project, which will represent one type of sensor.
Unfold the newly added attribute and fill in the details about your sensor type. This includes:
| ID | The ID of the sensor type (e.g. humidity) |
| Label | The Label of the sensor type (e.g. Humidity) |
| Attribute Type | Select between Binary (true, false) and Continuous (float, double) value |
| Unit | The Unit the value will represent (e.g. % or ml) |
| Minimum | The minimum value the sensor type will report |
| Maximum | The maximum value the sensor type will report |
After editing your Attribute you can add one or more visualization options by clicking on the '+' button next to the Visualization Option row and unfolding the newly created option.
Here you can choose between:
| Visualization Type | The type of visualization you want for your attribute type |
| Time Series | If the history of the data should be visualized for the attribute type |
To create additional visualizations for this attribute, click the '+' button again and select different options.
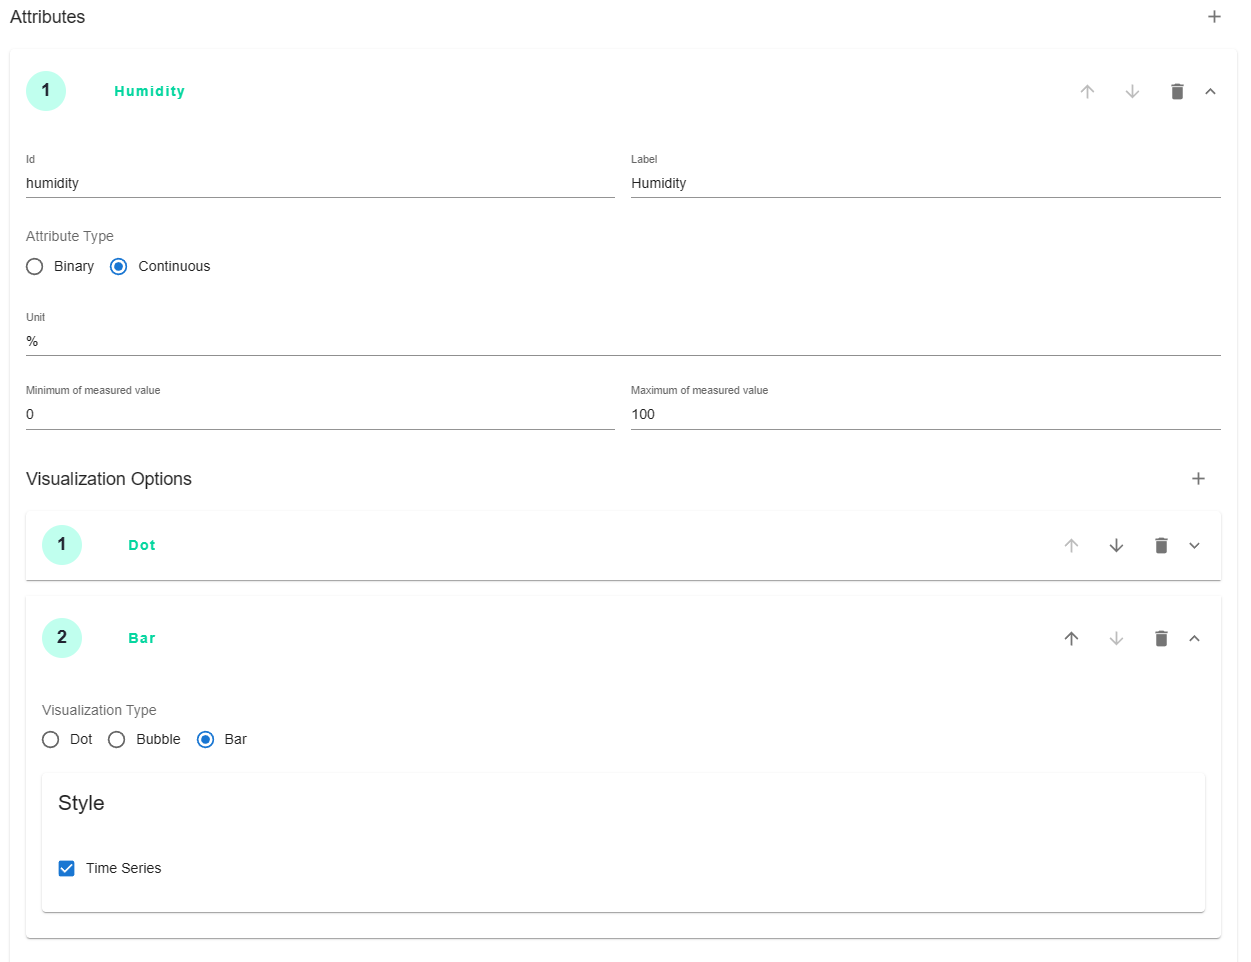
Fully configured attribute with its visualization options
You can repeat the steps for each sensor type you have and can add additional attributes and their visualization options you need.
Adding the project settings
On the left side of your configured attributes you will see a JSON Result that gets populated with the relevant code for the backend. By clicking the 'Copy' button you can copy it easily.
Additonally, save your configuration by clicking on the 'Save' symbol on the top right. If you want to load a previously created configuration click on the 'Load' symbol next to it.
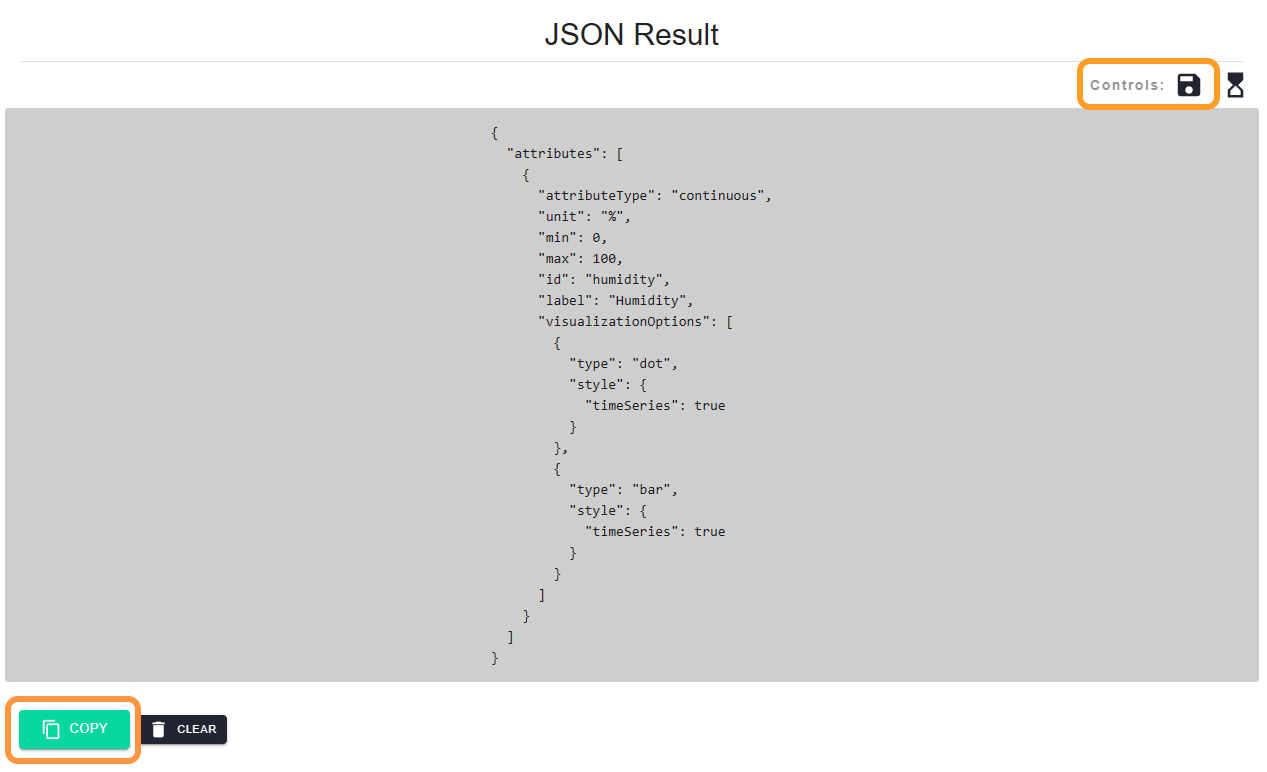
Additional Properties JSON for Backend
In your Dataskop Backend Tool go to "Home" -> "Firma bearbeiten" (Edit Company) -> Select your project in the list in the left project column and click on the 'Edit' button next to it.
Paste your copied JSON code in the text field "Zusätzliche Einstellungen" (Additional Properties) and click on the 'Save' button in the top right corner.
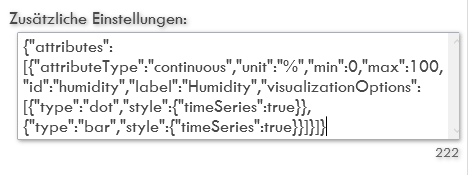
Additional Properties for Project
Now that you have informed the project about which sensor types will be available to visualize, you need to add info to each of your measurement definitions in order to link them to the correct attributes and devices.
By switching to the "Device Level" in the backend configurator at the top, you can generate small JSON Objects which you will then add to the measurement defintions.
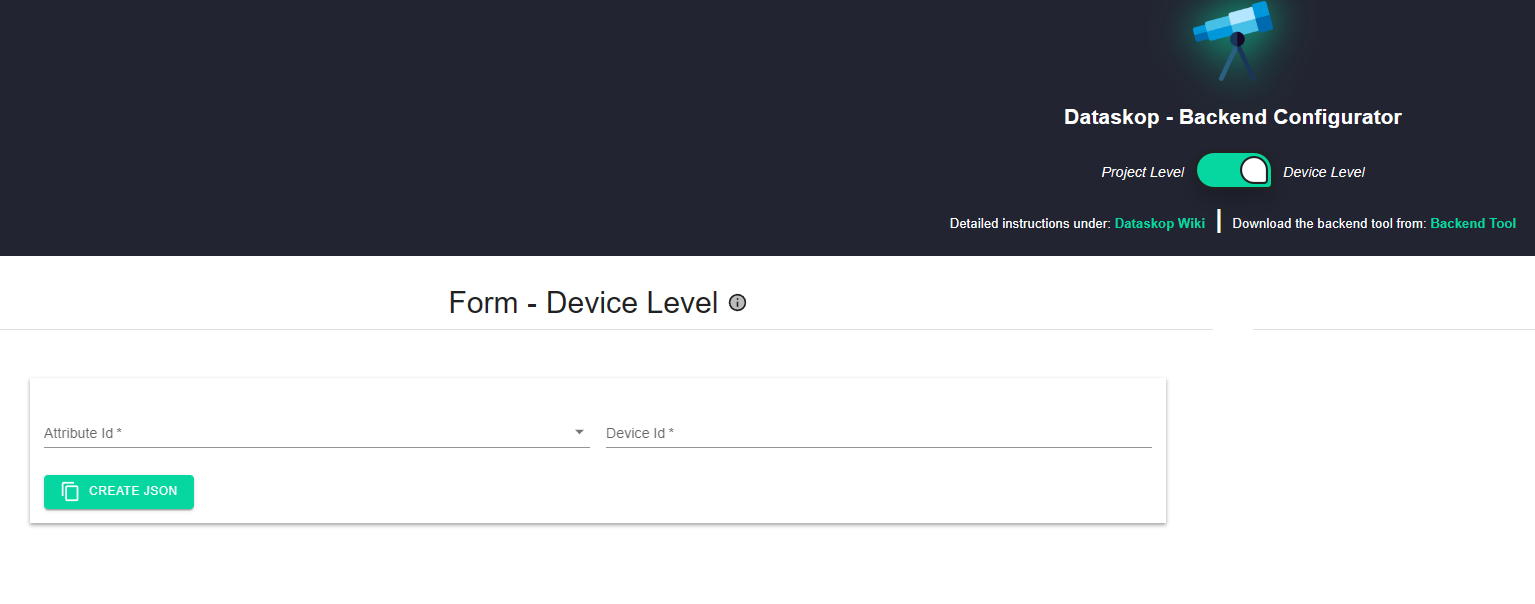
Device Level View
Select an attribute id you previously generated and add a distinct device id, then click on 'Create JSON'.
Repeat this step for each device that uses this sensor, and also for each attribute you want to visualize. You will end up with small JSON pieces on the right to copy, which you can now add to your measurement defintions.
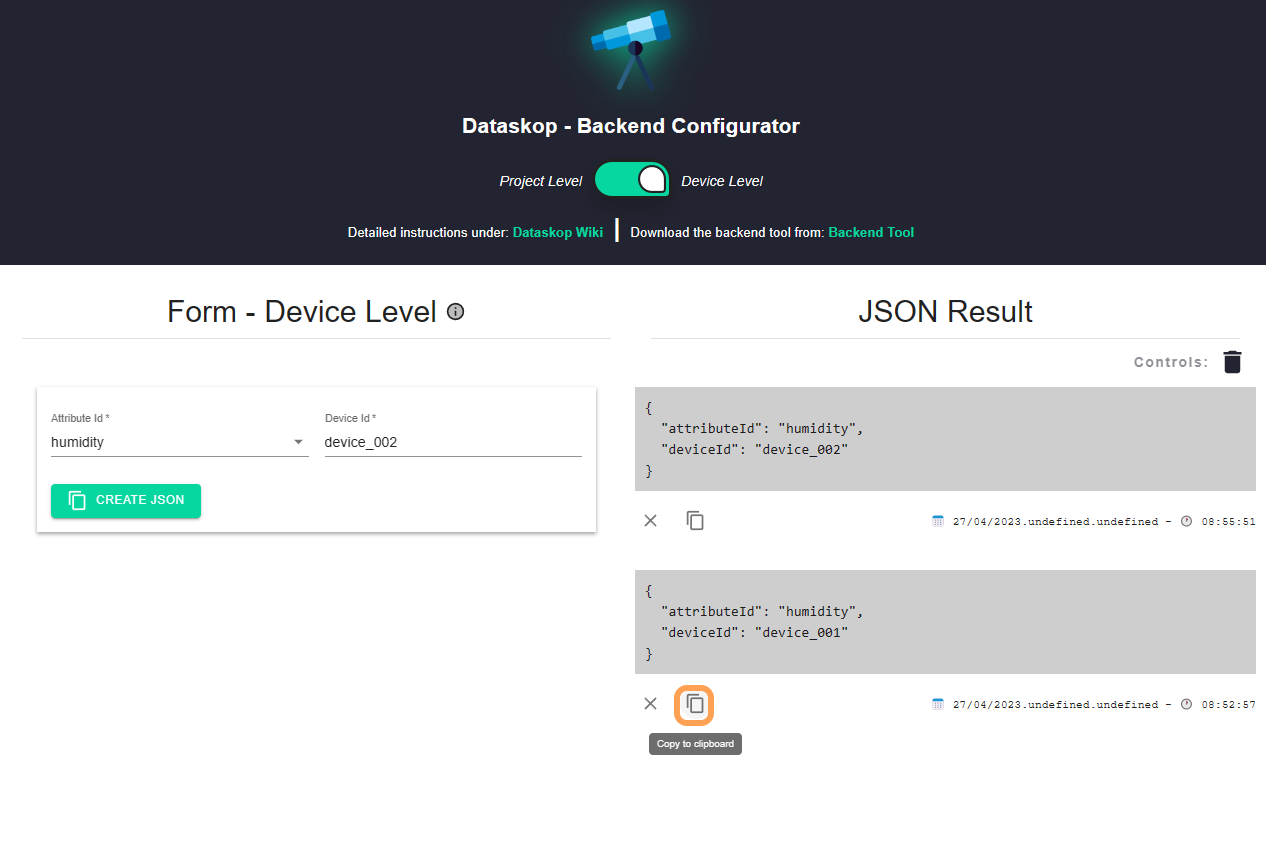
Configured Devices
In the Dataskop Backend Tool go to "Infrastructure" and select your created Gateway and the States IoT. Each measurement definition that is running virtually and is added to the project needs to be edited here by pressing on the 'Edit' button next to it.
In the Edit view of the measurement defintion you can give it a distinct name and, if the sensor is virtually created, a position and min/max limits for its generated values.
In the "Zusätzliche (dynamische) Daten" (Additional Properties) text field paste the according JSON object from the backend configurator device you created.
If you are done click the 'Save' button in the top right.
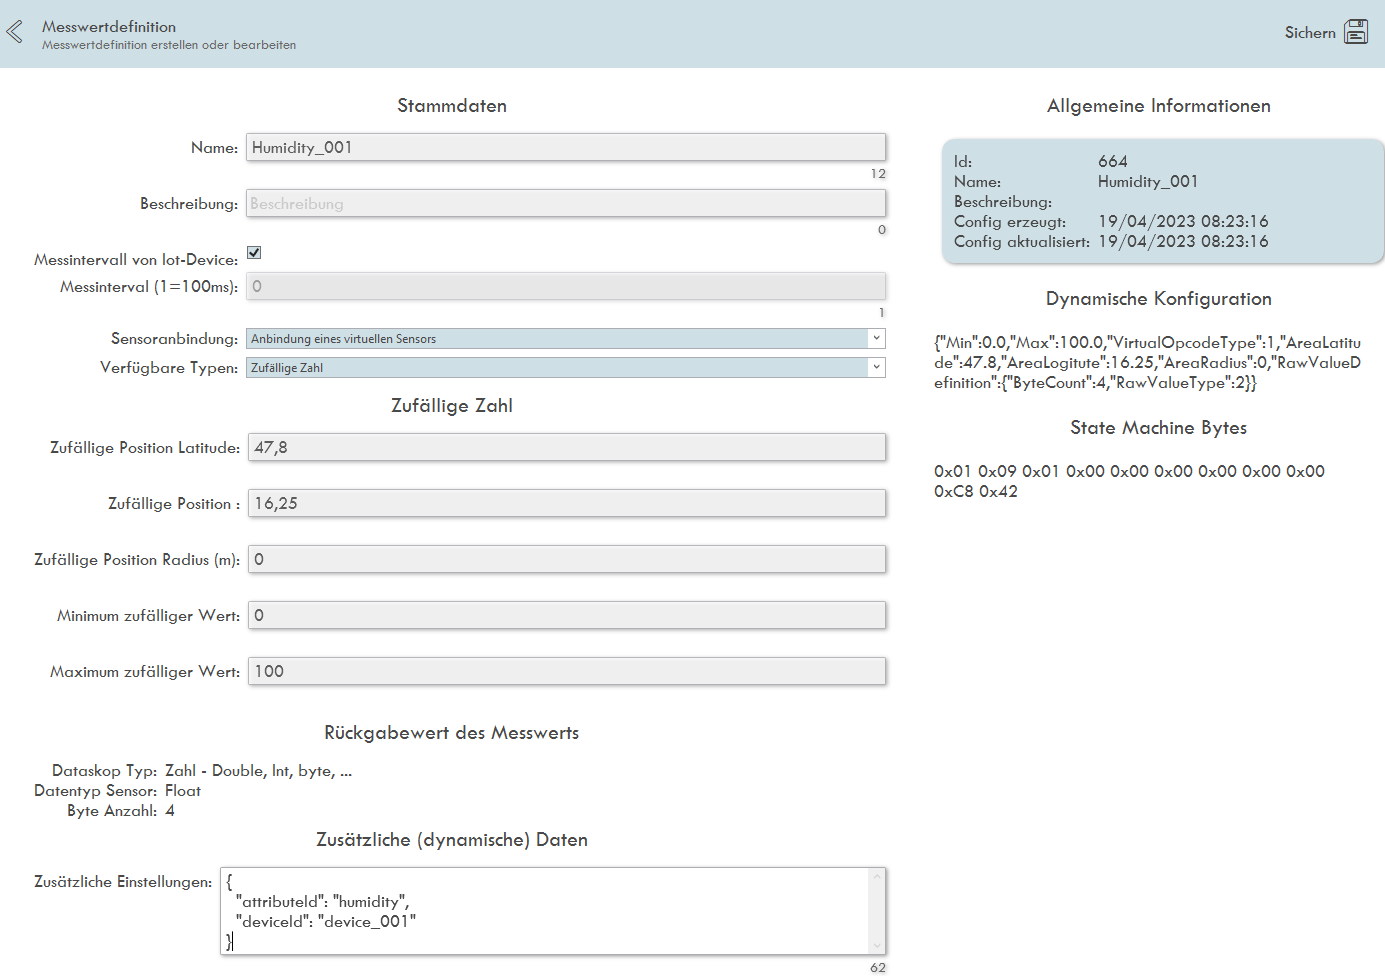
Measurement Definition Edit View
Repeat this editing of your measurement definitions with all attributes and all devices, but make sure to not use the same attribute and deviceid for two different measurement definitions.
Using DataskopAR for Android
Viewing the configured sensors is possible by downloading the latest DataskopAR APK and installing it on your Android device. For the best experience we recommend using a phone that supports Android 11 or higher.
Granting Access
When starting the app for the first time you will need to provide the access token to the backend in order to login and identify yourself. You can find your access token in the Dataskop Backend Tool by clicking on "Ich" and clicking the "Zugriffstoken" (Access Token) code on the right side to copy it. To avoid the tedious process of typing it in we recommend creating a QR Code with an Online Tool of your choice and save the access token as text in a QR Code.
On the Login screen in the AR app tap on "Scan" once you have created a QR Code and scan it to automatically populate the access token field and then tap on the "Login" button.
Once you are logged in, the next time you start the application the login screen will be skipped and the AR mode will automatically launch. You can logout from there in case you want to change access tokens.
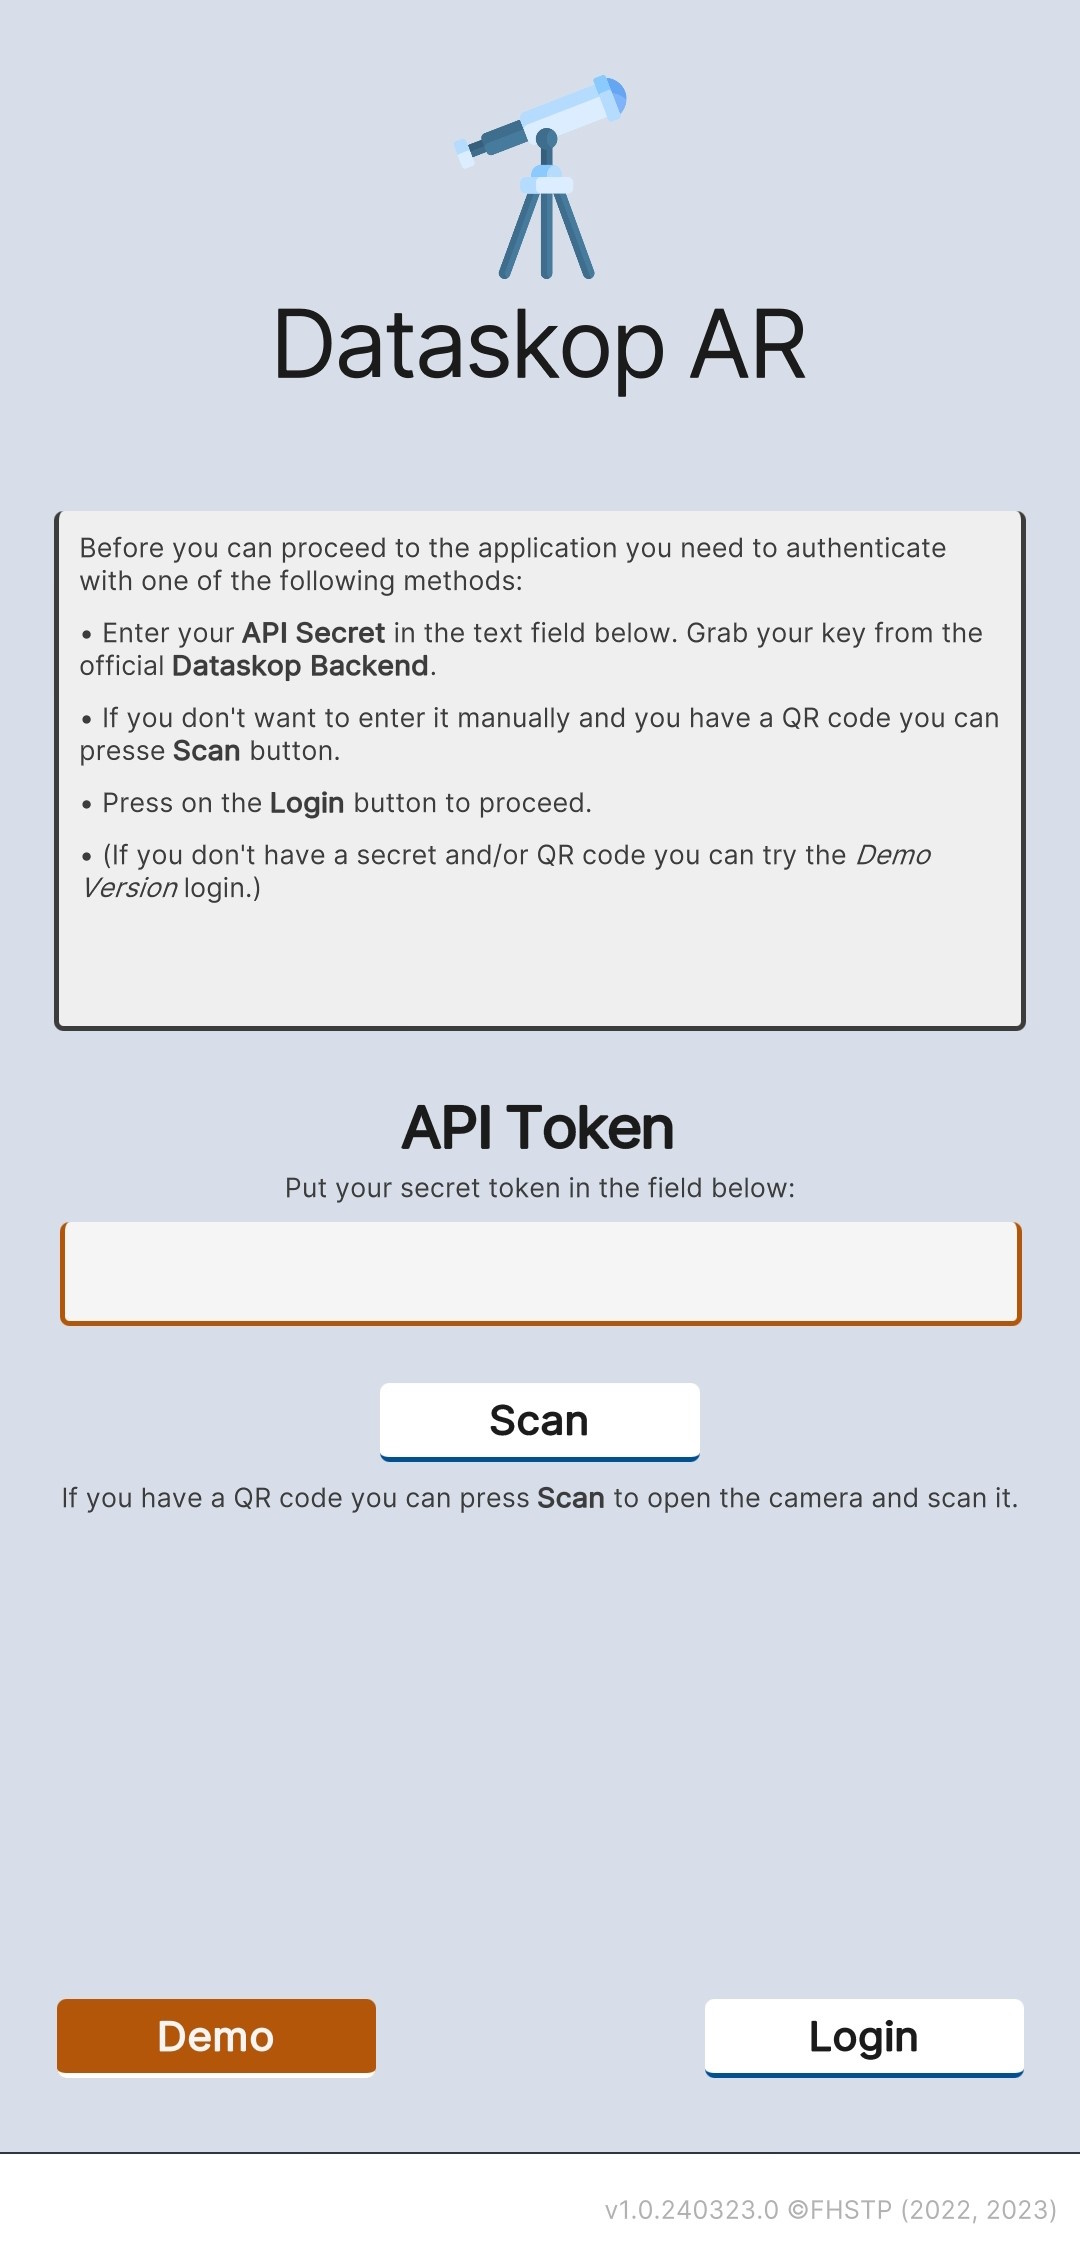
Dataskop AR Login View
Logged in, the application will start the AR mode and you may need to allow usage of location and camera features of your smartphone.
Calibrating AR
Everytime you start the application you need to calibrate some AR features. Go through the short calibration process, by clicking the buttons and following the instructions. Make sure to use the app in a well lit location as it can be difficult to scan the environment otherwise.
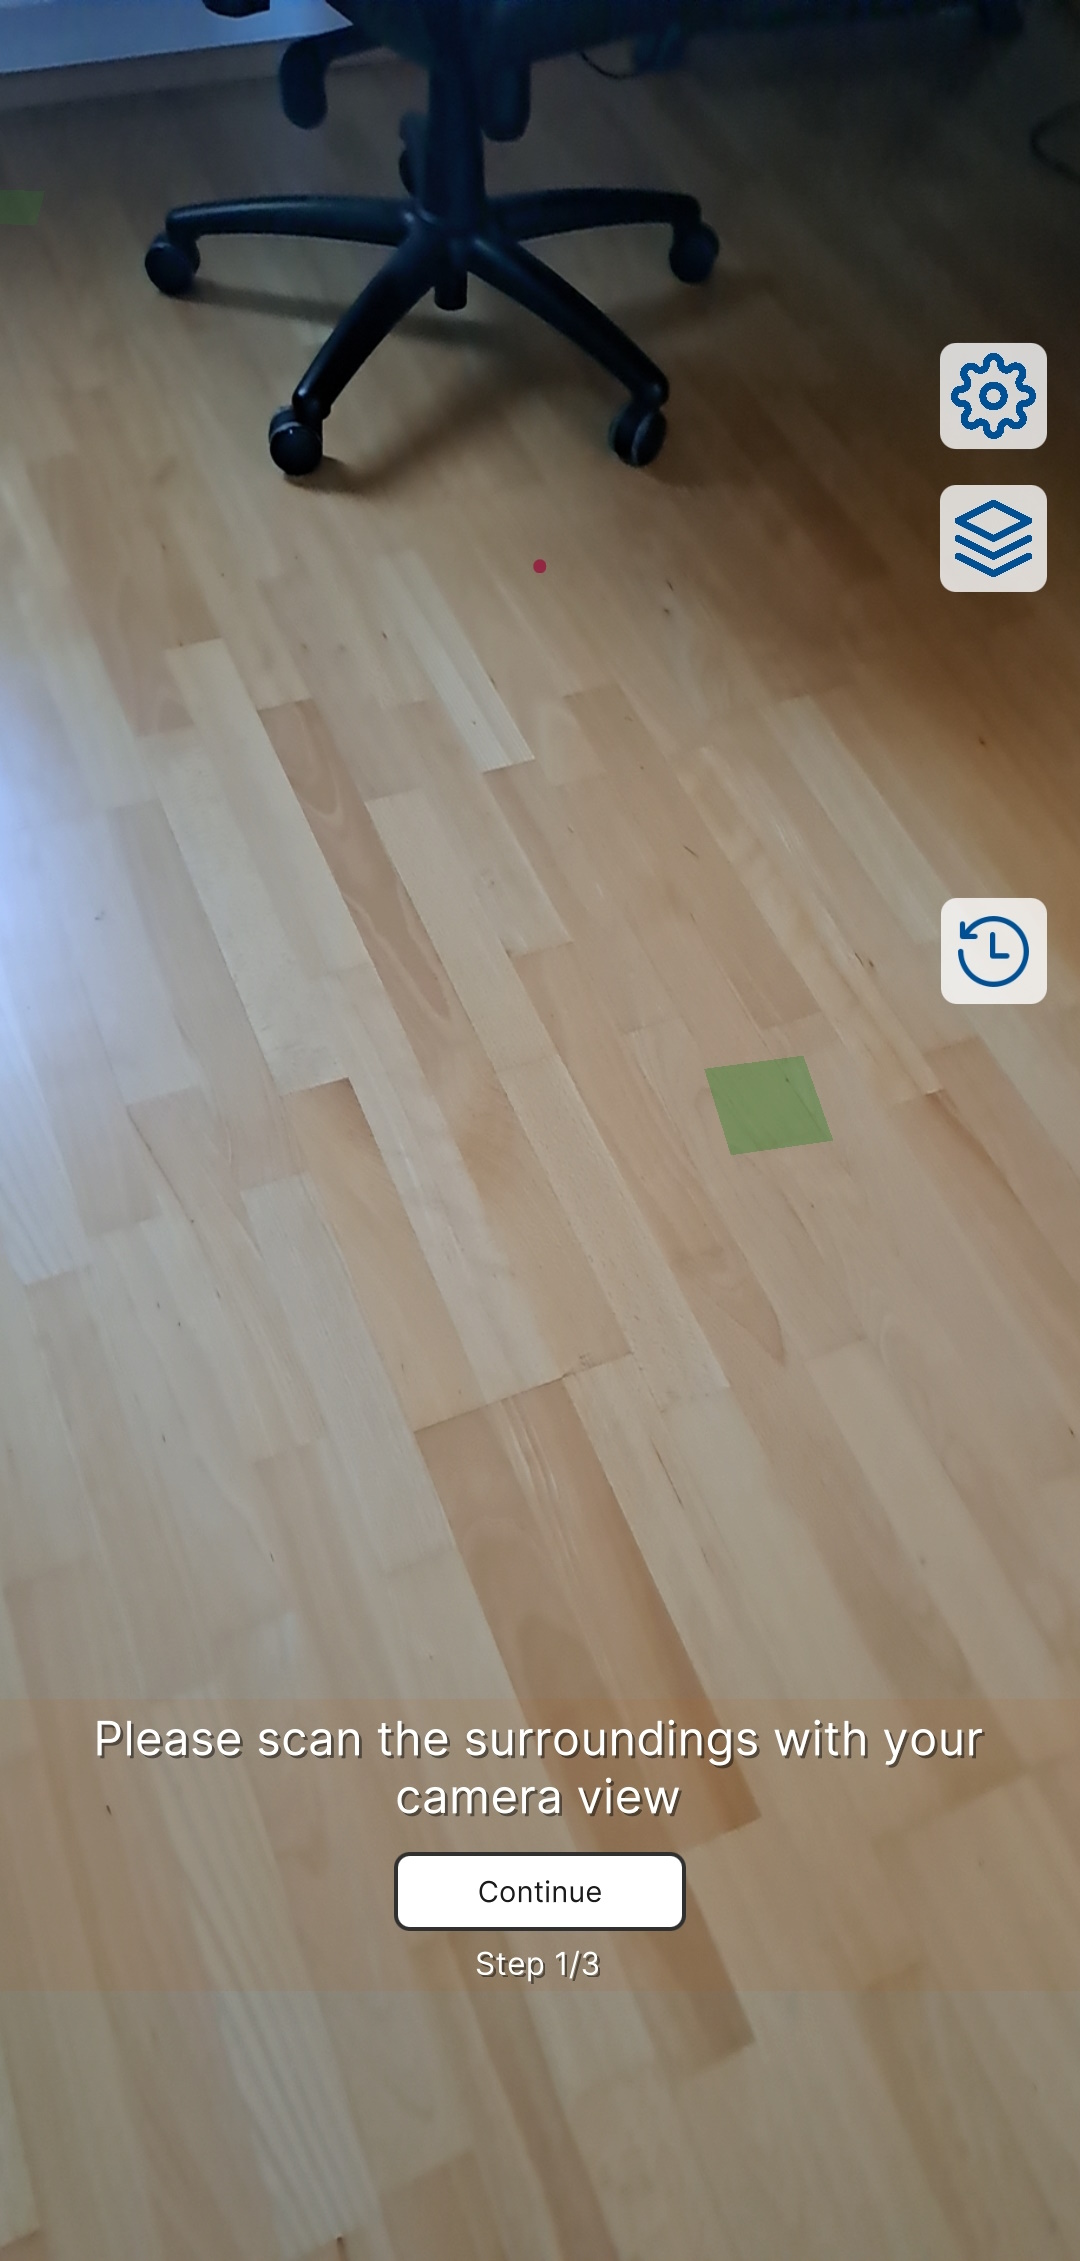
Calibration Process - Scanning Ground
Once the calibration process is done, it will try to automatically load the first project of the first company your access token is associated with. If everything was set up correctly a notification will pop up and several user interface elements will be displayed.
User Interface
Interacting with the user interface is done by tapping or swiping elements visible on the screen. Refer to the table to understand what each element represents:
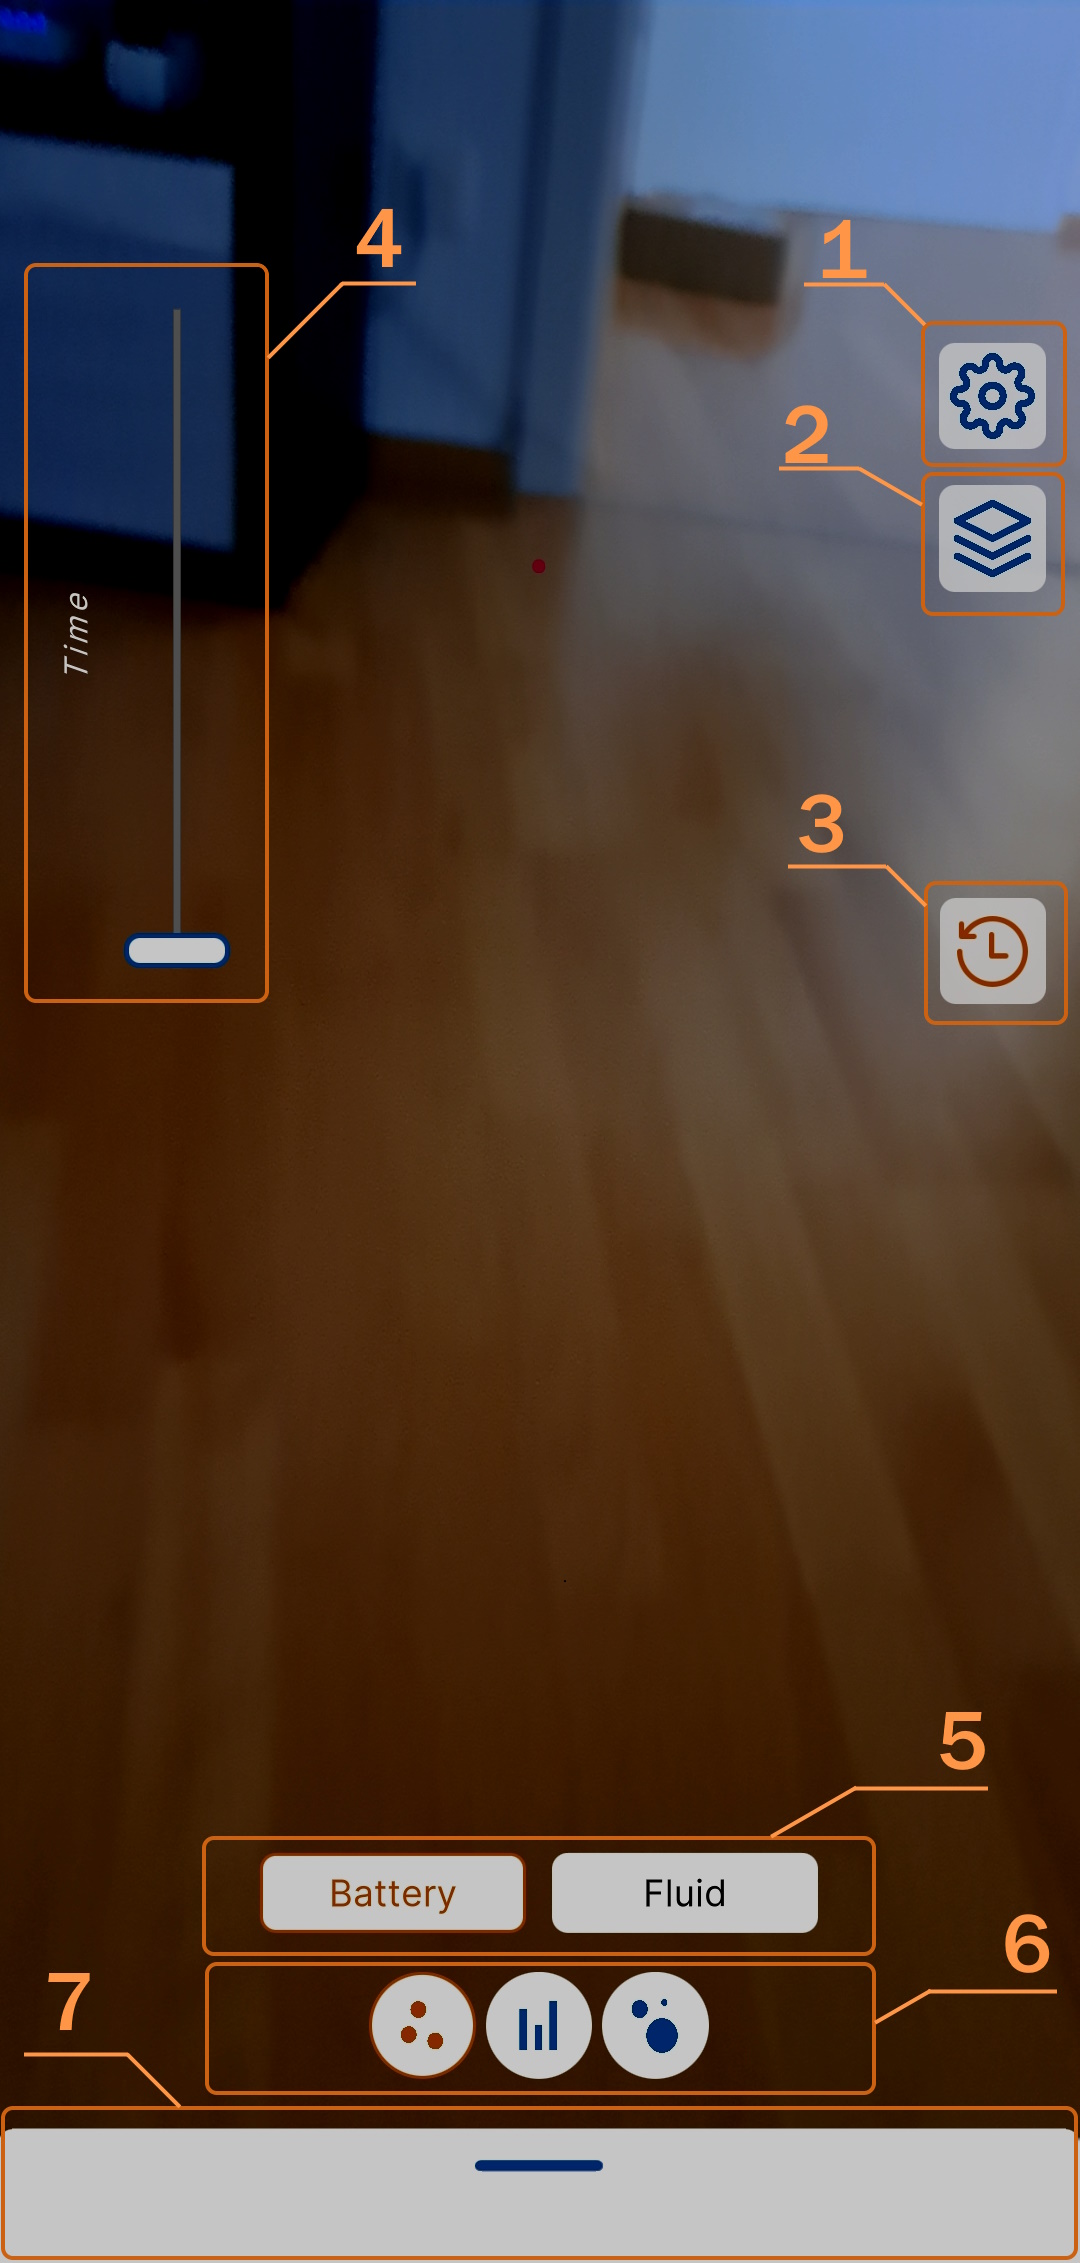
UI Elements
| 1. Settings Button | Opens the settings menu |
| 2. Project Selector Button | Opens the project selection menu |
| 3. Time Series Button | Disbable/Enable the display of Time Series |
| 4. Time Slider | Slider to go through the displayed time |
| 5. Attribute(s) | Available Attribute(s) for this project |
| 6. Visualization(s) | Available Visualization(s) for the selected Attribute |
| 7. Information Card | Information Card (collapsed by default) - swipe up/down on the handle to change its state |
Settings Menu
Use the settings to configure some app settings for the current session.
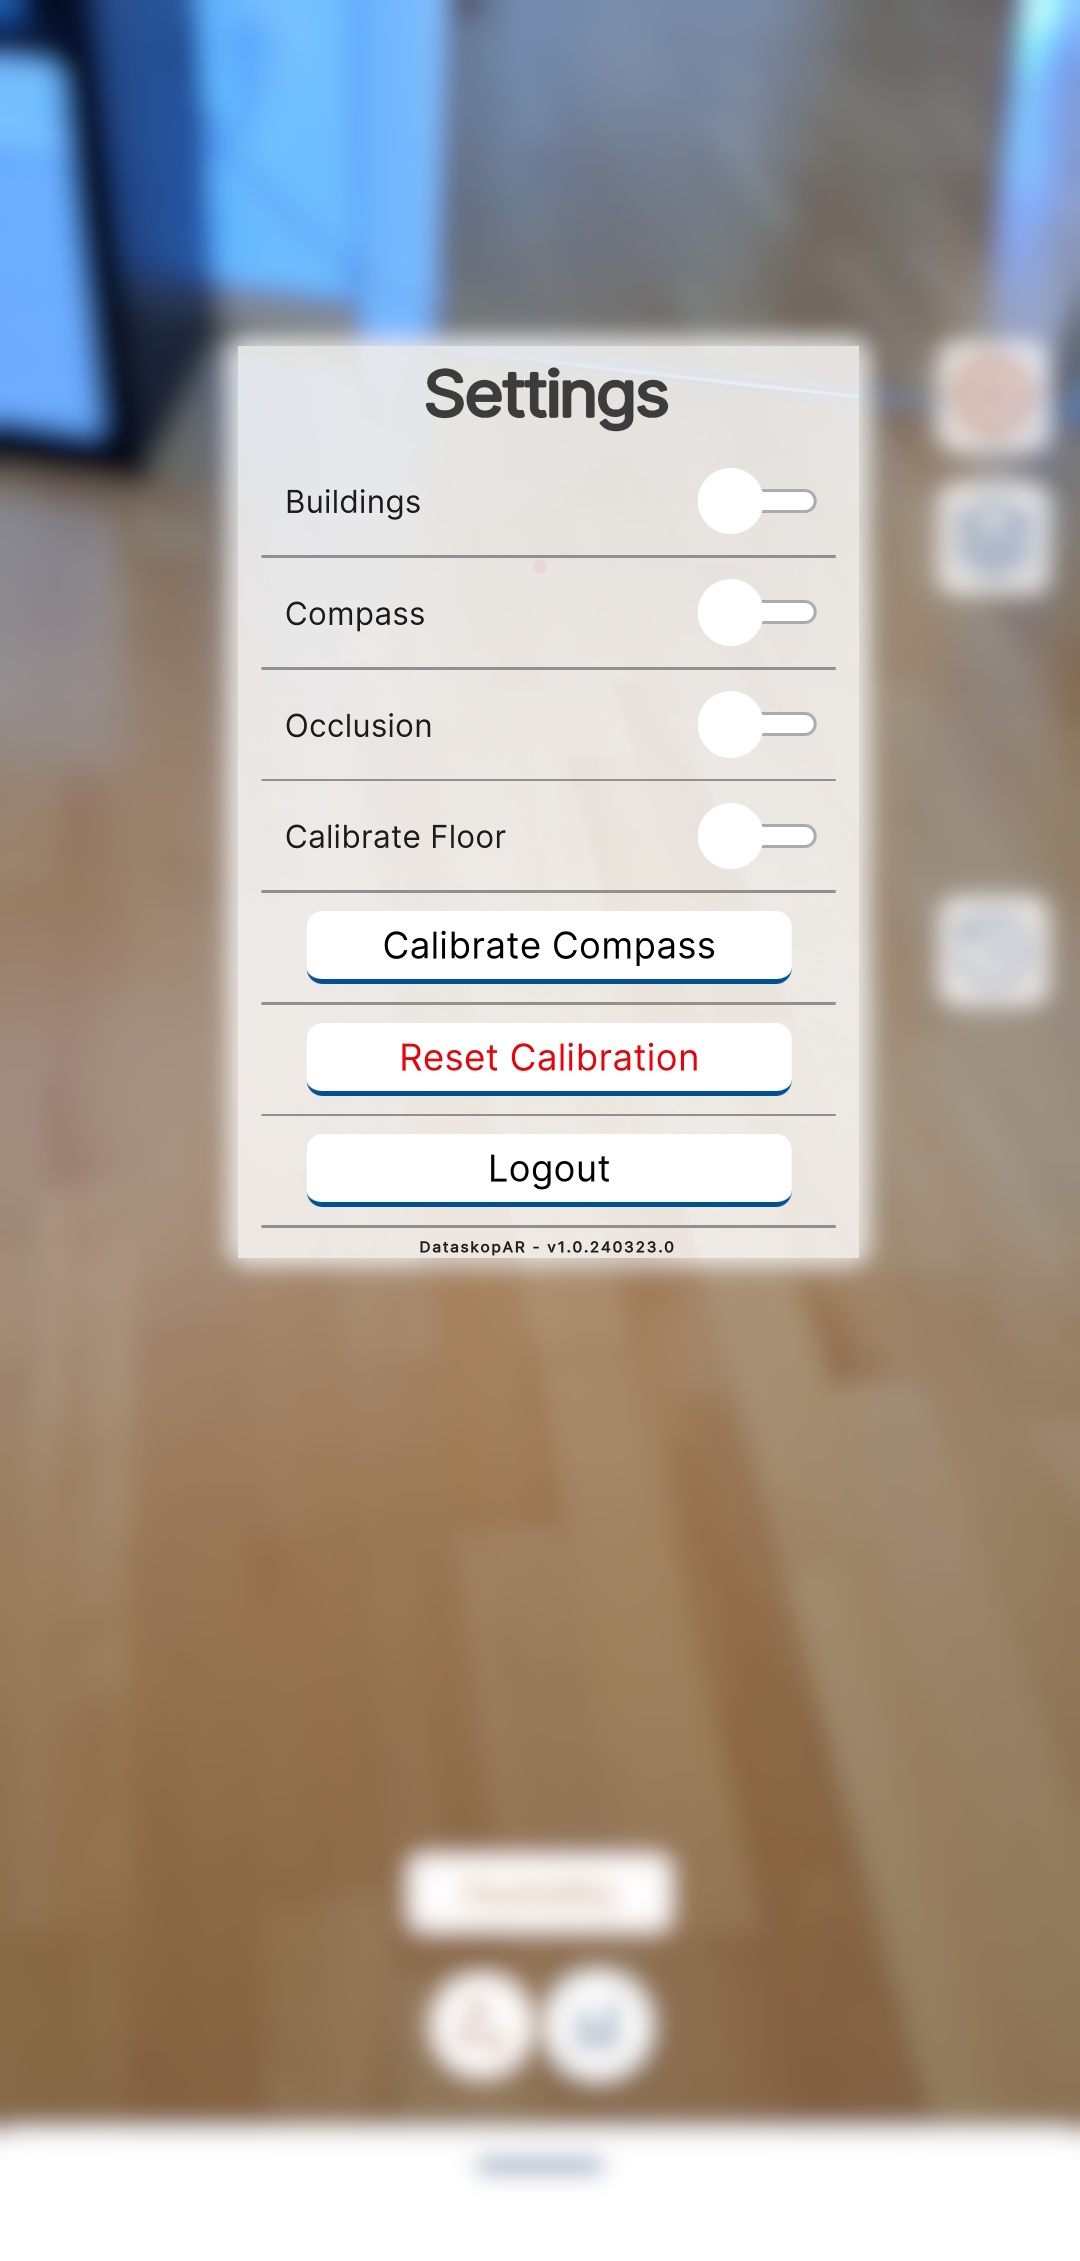
Application Settings
| Buildings | Enable/Disable models of buildings |
| Compass | Enable/Disable compass UI element for orientation |
| Occlusion | Enable/Disable occlusion culling (functionality depends on phone model) |
| Calibrate Floor | Enable/Disable calibration of floor detection in case it does not align correctly |
| Calibrate Compass | Tap to fetch new compass data in case it does not align correctly |
| Reset Calibration | Resets the AR application back to its initial calibration phase |
| Logout | Logs out the user and discards saved access token |
Selecting a Project
If necessary, tap the project selector button and switch to the created project by tapping it on the list of available projects. Projects are listed in the order they appear on the backend and are split into the companies you are part of. The currently selected project is marked by an orange line.
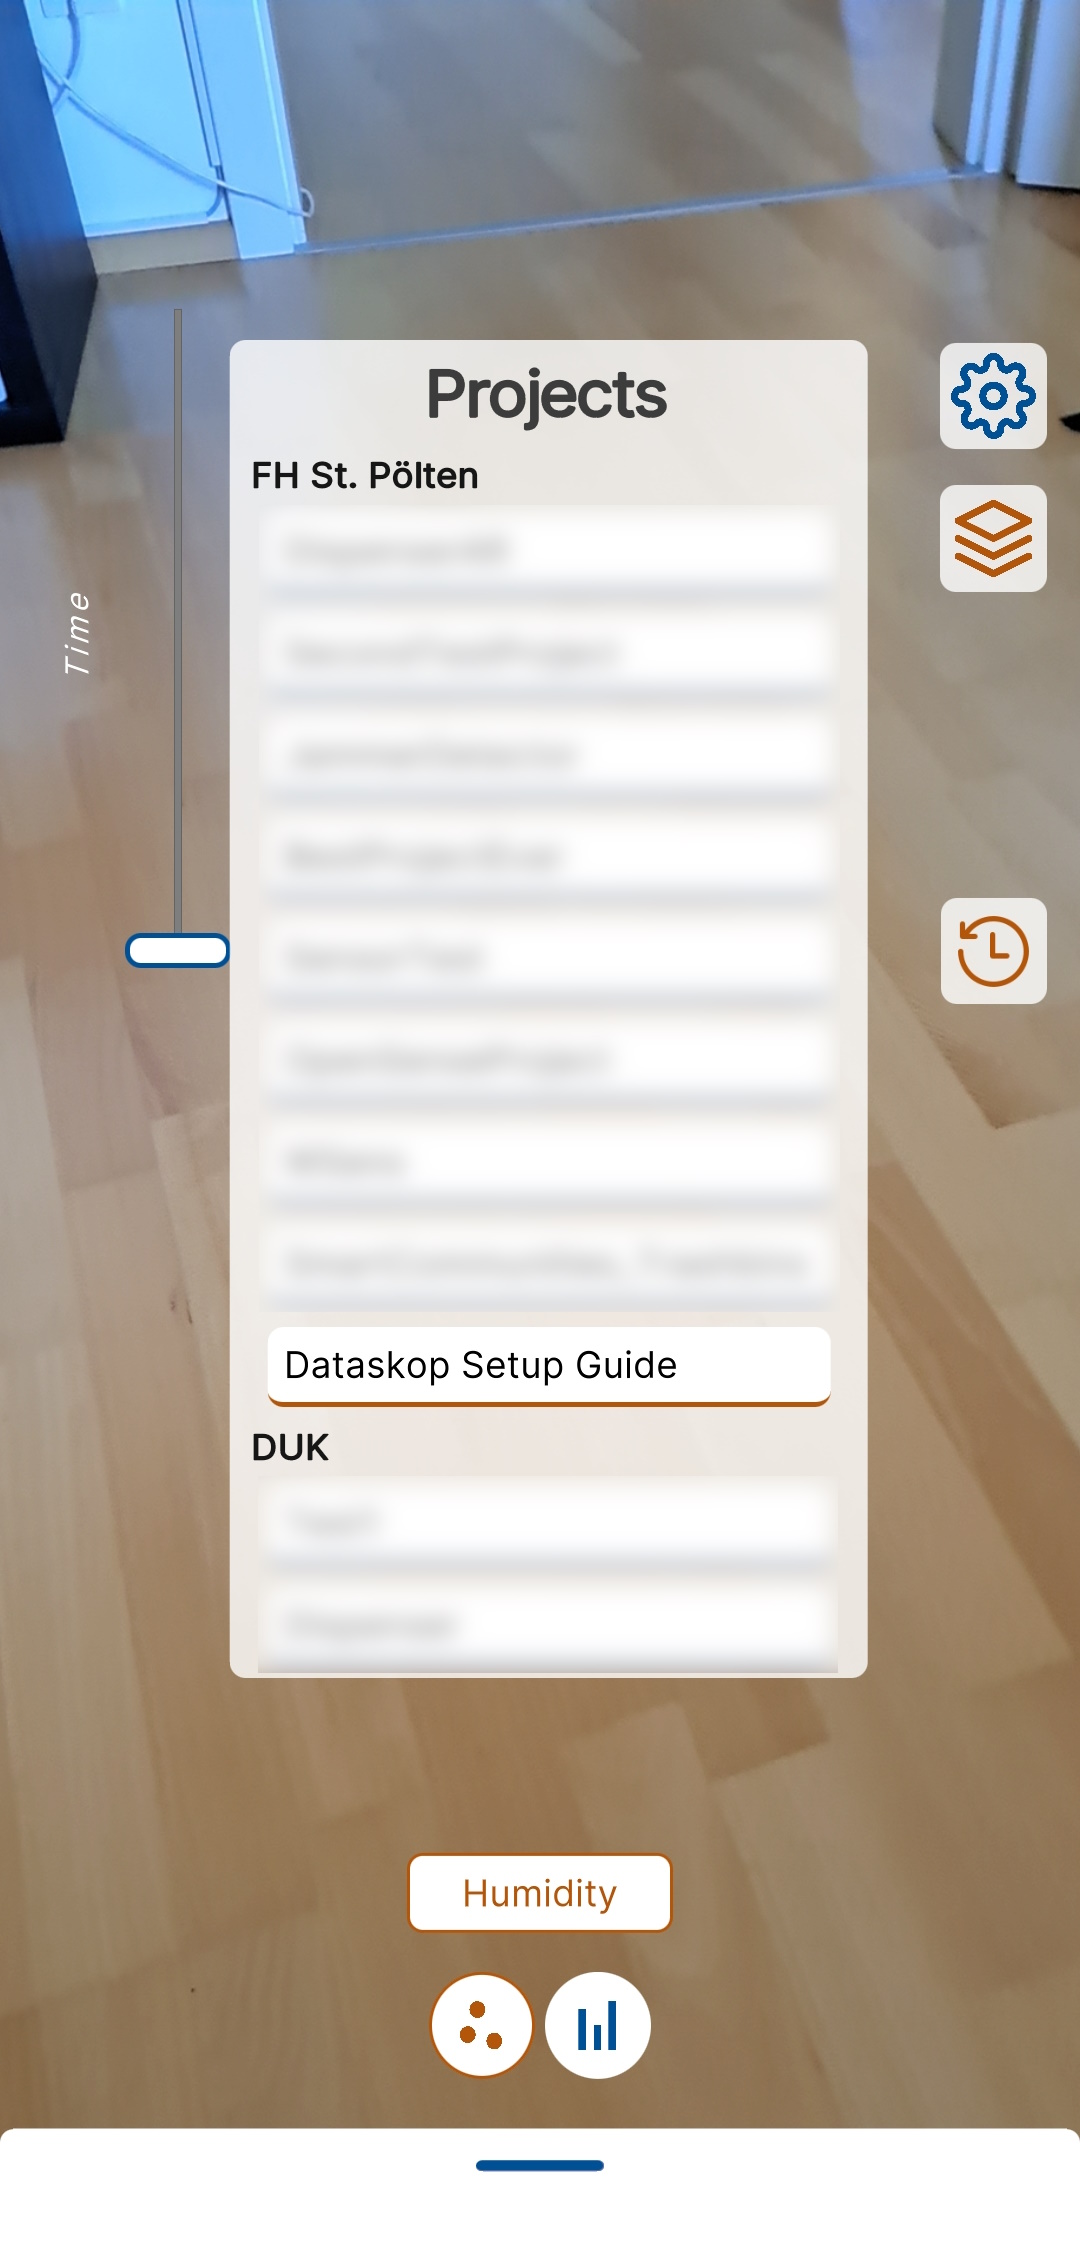
Project Selection
(Optional) Spoofing Location
As the application uses reallife coordinates grabbed by the GPS sensors of the users phone best location functionality and alignment with reallife sensors is achieved by being outside while having a good signal. If indoor usage is required we highly recommend to use our location spoofing.
You can achieve this by creating a QR code with text provided in the format "[ProjectName]@[Latitude,Longitude]". For example if a physical sensors location is at a specific location you can use these coordinates and create a QR code with "Dataskop Setup Guide@48.214138,15.632078", print it out and place it in its correct position.
Once the QR code is available you can simply point the camera at it and the app will automatically switch the project to the specified one (in case it is not selected yet) and sets the location to the provided one, displaying information in the correct location.
Interacting with Visualizations
TBD